
|

|
DACS: Gain Structure Diagram | 
|
|
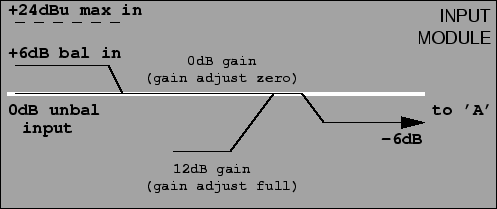
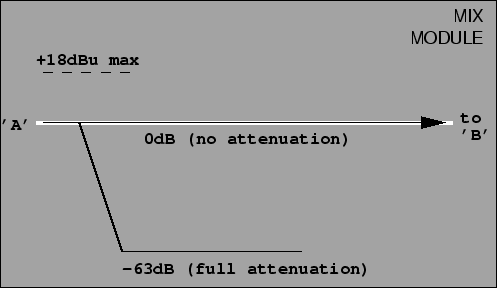
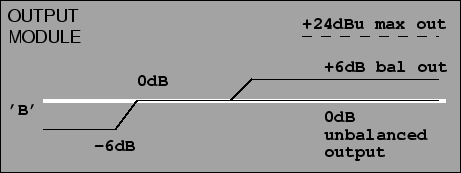
Next: Power Up: Mixer Unit Previous: Mixer Unit Contents Gain Structure DiagramTaking audio specifications in to account, overall system gain structure diagrams have been constructed. Figure 28 depicts the input gain structure for a single channel. Included in this section is gain reduction for a balanced input, adjustable trim control, and an overall gain reduction before passing to the next stage. Figure 29 depicts the gain structure for the mix stage of the mixer unit. This stage only attenuates the input signal, up to 63dB, as per the high-level specification. Figure 30 shows the gain structure for the output stage. Note a constant input section gain, and a constant gain on the balanced outputs.Steve Richardson 2000-07-06 |
Table of Contents
| |
![[PDF]](/~prefect/images/pdficonsmall.gif) [Whole document in PDF 1.9MB]
[Whole document in PDF 1.9MB]